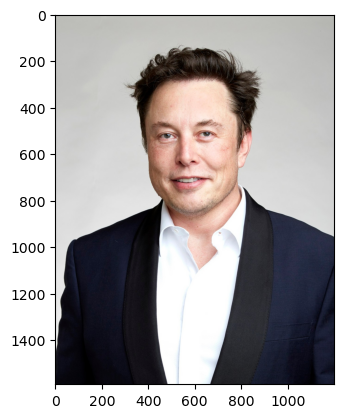
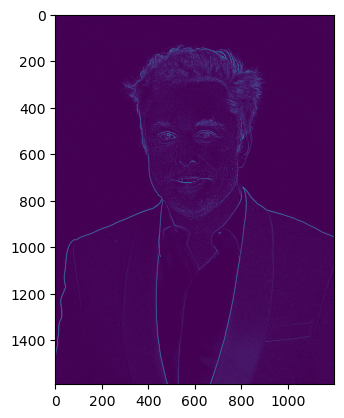
Laplacian operator edge detection is another popular technique for detecting edges in images in computer vision. Unlike the Sobel filter-based edge detection, which uses gradient information to detect edges, the Laplacian edge detection technique is based on the second derivative of the image.
The Laplacian operator is a 3×3 or 5×5 matrix that is applied to each pixel of an image. The operator is used to calculate the Laplacian of the image at that pixel location. The Laplacian of an image is a measure of how much the intensity of the image changes at that point, and it provides a more detailed description of the edges in an image compared to the gradient.
The Laplacian operator is applied to an image by convolving the operator with each pixel of the image. The result of the convolution is a new image that highlights the edges in the original image. This new image is called the Laplacian image, and it represents the magnitude of the Laplacian at each pixel location. Two commonly used kernels are shown in the below image.

The Laplacian edge detection technique uses a threshold to convert the Laplacian image into a binary image, where each pixel is either white or black. The threshold is chosen based on the desired level of sensitivity for detecting edges in the image. The resulting binary image is a map of the edges in the original image, which can be used for further analysis and processing in computer vision applications.
Overall, Laplacian edge detection can be more effective in detecting fine details and detecting edges at varying orientations, but it can also be more sensitive to noise in the image.
Laplacian Implementation in Python
In the below code, we have performed the following steps:
- First, we load the original image.
- As Laplacian is prone to be affected by noise, so best strategy is to remove unwanted noise by applying a Gaussian blur and then convert the original image to grayscale
- After performing gaussian blur, convert the image to grayscale.
- On a Grayscale image, apply a Laplacian operator and display the image output.
import cv2
import matplotlib.pyplot as plt
%matplotlib inline

# Read the original image
img = cv2.imread('elon.jpg')

RGB_img = cv2.cvtColor(img, cv2.COLOR_BGR2RGB)
plt.imshow(RGB_img)
src = cv2.GaussianBlur(RGB_img, (3, 3), 0)
# converting to gray scale
gray = cv2.cvtColor(src, cv2.COLOR_BGR2GRAY)

edges = cv2.Laplacian(gray, -1, ksize=3, scale=1,delta=0,borderType=cv2.BORDER_DEFAULT)
plt.imshow(edges)

