Sobel filter-based edge detection is a widely used technique in computer vision for detecting edges in images. The technique uses a mathematical operation called convolution to apply a set of filters to an image, which highlights the edges in the image.
The Sobel filter is a 3×3 matrix that is applied to each pixel of an image. The filter is used to calculate the gradient of the image at that pixel location. The gradient of an image is a measure of how much the intensity of the image changes at that point. If the gradient is high, it means there is a strong change in intensity, which indicates an edge in the image.
There are two Sobel filters: one for detecting edges in the horizontal direction and one for detecting edges in the vertical direction. The horizontal Sobel filter highlights edges that run from left to right, while the vertical Sobel filter highlights edges that run from top to bottom. The below matrices Gx and Gy denotes show the Sobel operator in the x and y direction respectively.
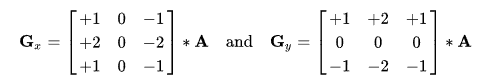
where A denotes the source image * represents the 2-dimensional convolution operation.
The Sobel filter is applied to an image by convolving the filter with each pixel of the image. The result of the convolution is a new image that highlights the edges in the original image. This new image is called the gradient image, and it represents the magnitude of the gradient at each pixel location.
Finally, the Sobel filter-based edge detection technique uses a threshold to convert the gradient image into a binary image, where each pixel is either white or black. The threshold is chosen based on the desired level of sensitivity for detecting edges in the image. The resulting binary image is a map of the edges in the original image, which can be used for further analysis and processing in computer vision applications.
Python Implementation
Here’s a code for implementing sobel filter-based edge detection in python.
import cv2
import matplotlib.pyplot as plt
%matplotlib inline
# Read the original image
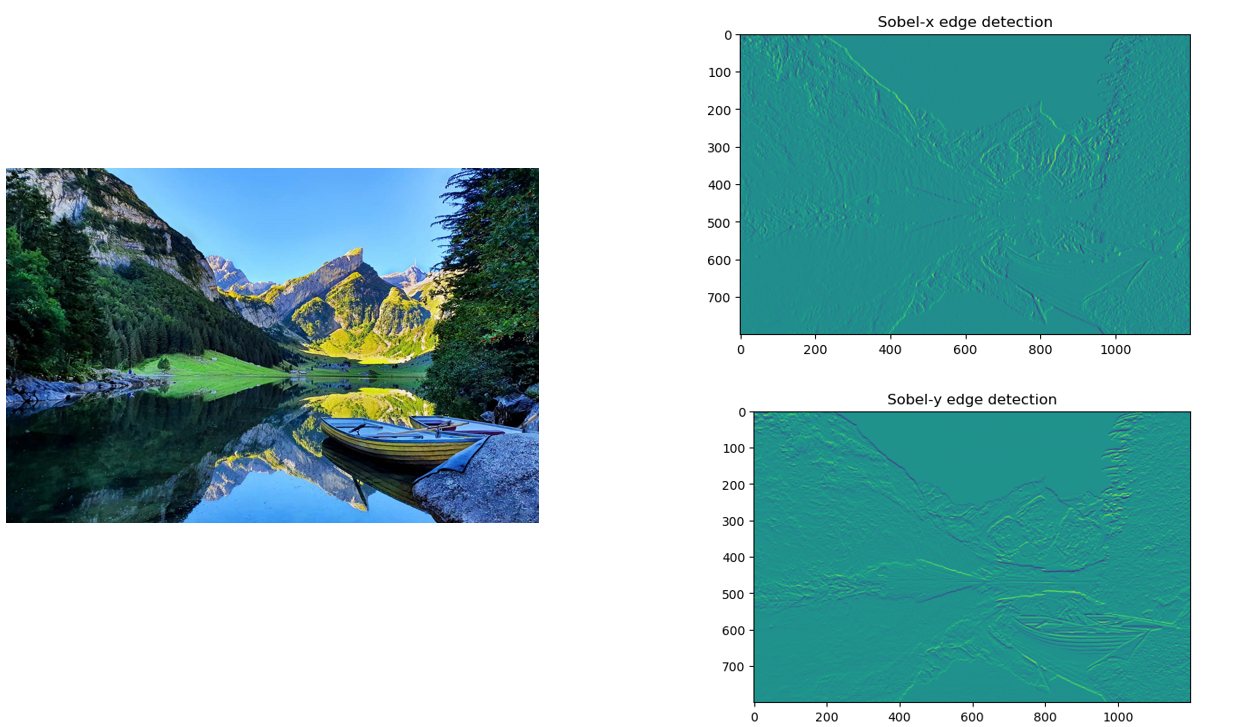
img = cv2.imread('nature.jpg')
# converting because opencv uses BGR as default
RGB_img = cv2.cvtColor(img, cv2.COLOR_BGR2RGB)
plt.imshow(RGB_img)

# converting to gray scale
gray = cv2.cvtColor(RGB_img, cv2.COLOR_BGR2GRAY)
# remove noise
img = cv2.GaussianBlur(gray,(3,3),0)
# convolute with sobel kernels
sobelx = cv2.Sobel(img,cv2.CV_64F,1,0,ksize=5) # x
sobely = cv2.Sobel(img,cv2.CV_64F,0,1,ksize=5) # y
#Plotting images
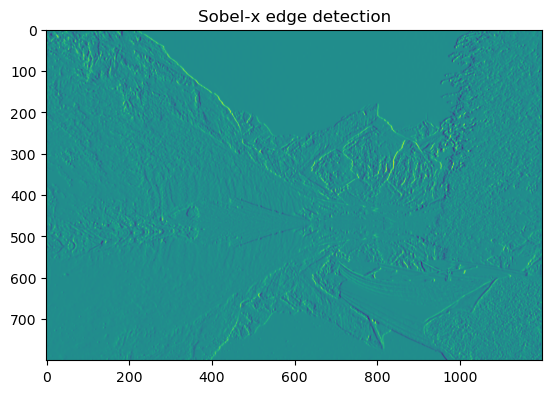
plt.imshow(sobelx)
plt.title("Sobel-x edge detection")
plt.imshow(sobely)
plt.title("Sobel-y edge detection")