Table of Contents
Machine learning is the most revolutionalizing field in computer science that allows computers to learn from the data by analyzing the pattern without being explicitly programmed.
Logistic Regression is the most popular algorithm in machine learning, which is generally used for classification problems. In this article, we will explain logistic regression in machine learning in detail with real-time examples to make you understand better.
What is Logistic Regression?
Logistic Regression is a type of supervised learning algorithm that uses labeled data to train the model for making predictions. Logistic regression is a widely used statistical algorithm used to model the probability of a binary outcome, such as yes or no, true or false, or 0 or 1.
In logistic regression, the dependent variable or target variable is a categorical variable having 2 categories, and the independent variables (features) can be either continuous or categorical.
The equation for univariate Logistic regression is as follows:
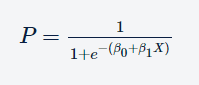
Where P is the probability of the outcome, e is the base of the natural logarithm, and (β0 +β1X) is the linear combination of the input variables.
The above equation has only one independent variable X, for which the coefficient is β1 whereas β0 is constant.
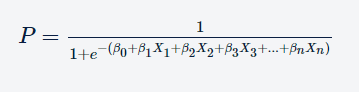
Consider if we have multiple independent variables, say n, then we can simply modify this equation with ‘n’ feature variables and ‘n’ corresponding coefficients such that the equation becomes:
Example of Logistic Regression
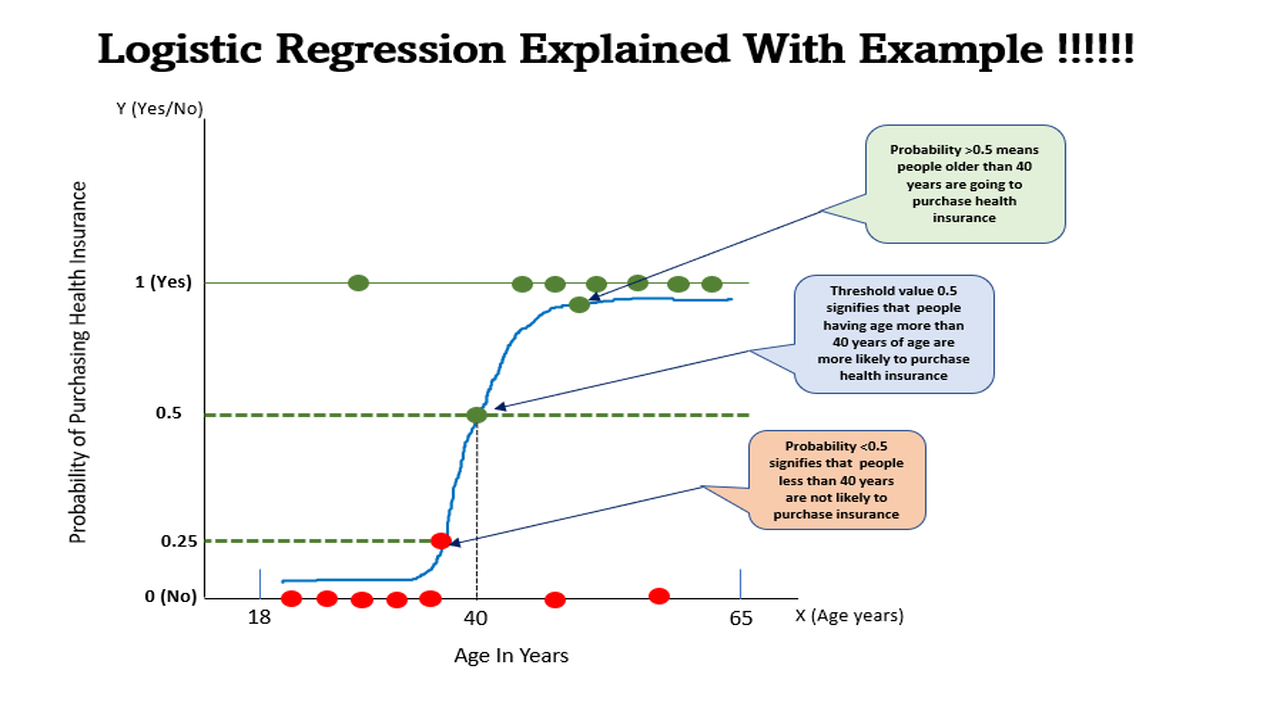
Let’s consider the problem of purchasing health insurance based on the age of the people. So, here there is one variable age based on which target variable purchase need to be predicted. Here, the purchase means whether people going to purchase health insurance or not.
So, let’s try to solve this problem using Logistic Regression. As per Fig.1, we can observe that this problem can be generalized by drawing an S-shaped curve also known as a sigmoid curve. People aged 40 years have a probability of 0.5 means these guys are more likely to purchase health insurance whereas guys having a probability >0.5 are definitely going to purchase health insurance. On the other hand, probability <0.5 signifies there are very less chances or no chances to purchase health insurance.
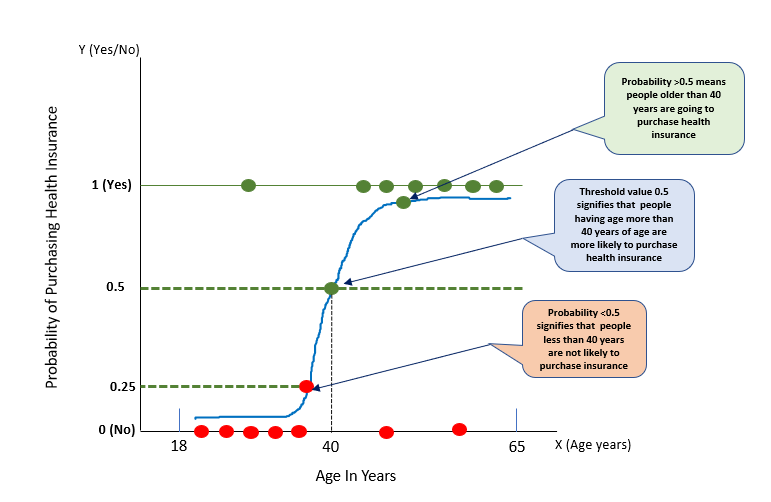
So, from the above example, we can observe that predicted values can be mapped to probabilities using a mathematical function known as the sigmoid function.
Therefore, any real value can be mapped into a value within a range of 0 and 1 which signifies that the value of the logistic regression must be between 0 and 1.
From the above Fig.1, we can also observe that the logistic regression follows the concept of the threshold value, which defines the probability of either 0 or 1.
Any value exceeding the threshold value signifies 1 whereas a value below the threshold value signifies 0.
Assumptions of Logistic Regression
Logistic regression makes the following assumptions:
- Linearity: The relationship between the independent variables and dependent variables should be linear.
- Independence: The observations are independent of each other. It means independent variables should not be dependent on themselves.
- Absence of multicollinearity: The independent variables are not highly correlated with each other.
- Large sample size: There should be at least 30 observations for each independent variable.
- Binary dependent variable: The dependent variable is binary i.e., 0 or 1. This is the most important assumption of Logistic Regression.
Types of Logistic Regression
Logistic regression can be classified into three major types follows:
- Binary Logistic Regression: When the dependent variable has only two categories. For example, we have to predict whether a patient is suffering from diabetes or not based on a certain medical condition.
- Multinomial Logistic Regression: When the dependent variable has more than two categories. For example, we have to predict whether a banking transaction is safe, fraudulent, or doubtful based on account level and transaction level details.
- Ordinal Logistic Regression: When the dependent variable has ordered categories. For example, we have a situation for diagnosing a patient having high, mild, or severe viral infection based on a certain medical condition.
Difference between Logistic Regression and Linear Regression
Linear regression and logistic regression are both techniques used in statistical modeling to predict an outcome variable based on one or more input variables. However, there are some key differences between the two:
- Outcome variable: Linear regression is used when the outcome variable is continuous i.e., the numerical value within a certain range. Examples of continuous outcome variables include the price of a house, the height of a person, or the temperature of a room. However, Logistic regression is used when the outcome variable is binary or categorical, meaning that it can take on only one of two or more discrete values. Examples of binary or categorical outcome variables include whether someone has a disease or not and whether a customer will buy a product or not.
- Model output: The output of linear regression is a continuous numerical value that represents the predicted value of the outcome variable. On the other hand, the output of logistic regression is a probability value between 0 and 1, representing the likelihood of an observation belonging to a particular category.
- Model assumptions: Linear regression assumes that there is a linear relationship between the input variables and the outcome variable and that the errors are normally distributed and independent of each other. Logistic regression assumes that the log odds of the outcome variable are a linear combination of the input variables and that the errors are independent and follow a binomial distribution.
- Interpretation: In linear regression, the coefficient estimates for the input variables indicate the magnitude and direction of the relationship between each input variable and the outcome variable. In logistic regression, the coefficient estimates represent the change in the log odds of the outcome variable associated with a one-unit increase in the input variable.
Overall, the main difference between linear regression and logistic regression is the type of outcome variable they are used for and the form of their model equations.
Applications of Logistic Regression
Logistic regression has a wide range of applications in various fields, such as healthcare, finance, and marketing. Some common use cases of logistic regression include:
- Medical research: Logistic regression can be used to predict the likelihood of a patient developing a particular disease based on their age, gender, and other risk factors.
- Marketing: Logistic regression can be used to predict the likelihood of a customer purchasing a product based on their demographic and behavioral data.
- Social sciences: Logistic regression can be used to predict the likelihood of a particular behavior or outcome based on factors such as age, education level, and socioeconomic status.
- Finance: Logistic regression can be used to predict the likelihood of default on a loan based on factors such as credit score, income, and debt-to-income ratio.
- Natural sciences: Logistic regression can be used to predict the presence or absence of a particular species of plant or animal based on environmental factors such as temperature, rainfall, and soil type.
- Engineering: Logistic regression can be used to predict the likelihood of equipment failure based on factors such as temperature, humidity, and usage patterns.
FAQs
Q1. What is logistic regression, and how is it different from linear regression?
Ans. Logistic regression is a statistical method used to model a binary or categorical outcome variable based on one or more input variables. It estimates the probability of an outcome occurring given the input variables, whereas linear regression predicts a continuous outcome variable based on the input variables.
Q2. What is the logistic function, and how is it used in logistic regression?
Ans. The logistic function is a mathematical function used to model the relationship between the input variables and the outcome variable in logistic regression. It converts a linear combination of input variables into a probability value between 0 and 1, which represents the likelihood of the outcome variable being in a particular category.
Q3. What are the assumptions of logistic regression?
Ans. The assumptions of logistic regression include linearity of the input variables, independence of errors, absence of multicollinearity, and a large sample size relative to the number of input variables.
Q4. How do you interpret the coefficients in logistic regression?
Ans. The coefficients in logistic regression represent the change in the log odds of the outcome variable associated with a one-unit increase in the corresponding input variable. A positive coefficient indicates that the input variable increases the likelihood of the outcome variable being in a particular category, while a negative coefficient indicates the opposite.
Q5. What is overfitting, and how can you avoid it in logistic regression?
Ans. Overfitting occurs when the model is too complex and fits the training data too closely, resulting in poor generalization performance on new data. To avoid overfitting in logistic regression, you can use regularization techniques such as L1 or L2 regularization, or use a validation set or cross-validation to evaluate the model performance on new data.
Q6. What are some common applications of logistic regression?
Ans. Logistic regression is commonly used in fields such as medical research, marketing, social sciences, finance, natural sciences, and engineering to predict the likelihood of an event or outcome based on a set of predictors.
Q7. Can logistic regression be used for multiclass classification problems?
Ans. Yes, logistic regression can be extended to handle multiclass classification problems using techniques such as one-vs-rest or softmax regression.
Q8. What is the difference between logistic regression and decision trees?
Ans. Logistic regression is a parametric model that estimates the relationship between input variables and the outcome variable using a fixed set of coefficients. Decision trees are a non-parametric model that recursively splits the input space based on the input variables to predict the outcome variable.
Q9. How do you evaluate the performance of a logistic regression model?
Ans. The performance of a logistic regression model can be evaluated using metrics such as accuracy, precision, recall, F1 score, and area under the receiver operating characteristic (ROC) curve.
Q10. What is the difference between L1 and L2 regularization in logistic regression?
Ans. L1 regularization penalizes the sum of the absolute values of the coefficients, resulting in sparse models with some coefficients set to zero. L2 regularization penalizes the sum of the squared values of the coefficients, resulting in models with smaller coefficients but no coefficients set to exactly zero.
Q11. Can logistic regression handle missing data?
Ans. Logistic regression requires complete data for all input variables, so missing data must be handled before fitting the model. Common approaches include imputation methods such as mean imputation, regression imputation, or multiple imputations.
Q12. What are some common issues with logistic regression, and how can you address them?
Ans. Common issues with logistic regression include overfitting, multicollinearity, and outliers. To address these issues, you can use regularization techniques, remove correlated input variables, or use robust regression methods that are less sensitive to outliers.
Q13. How do we assess goodness of fit in the logistic regression model?
Ans. Akaike Information Criterion (AIC) is a statistical measure that is commonly used to assess the goodness of fit of a logistic regression model. The AIC is calculated based on the likelihood of the model and the number of parameters used in the model.
The AIC takes into account both the model’s fit to the data and its complexity, which means that it can help identify the most parsimonious model that fits the data well. In other words, the model with the lowest AIC is considered the best fit, as it strikes a balance between model complexity and goodness of fit.